Simple Sales Dashboard
- Luycer Bosire

- Feb 1, 2023
- 3 min read
Updated: Feb 4, 2023
A huge part of a career in data is differentiating the different roles held by specialists. This could be from a knowledge perspective but also to reduce on the pressure to know it all.
For finance professionals like myself, an easy career step into data would be in business intelligence (BI). There are easily many transferable skills given an already existing business acumen knowledge and the ability to translate what the data means for profit generation which is the main driver of most profitable institutions.

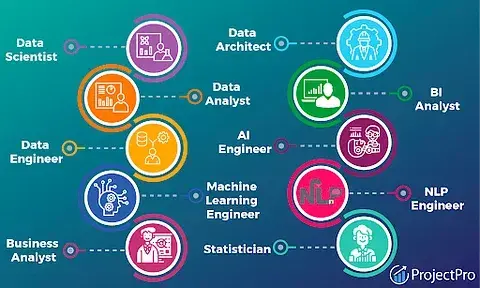
There lies an inherent difference between various role players in business intelligence experts; data analysts, data vizualization experts, data engineers and business leaders. One differentiating factor is definitively the tools of data analysis, call them tools of trade used, along with the role description and delivery expectations.
Data analysts mostly make use of historic data to deliver specific reports and metrices, on a request basis, for business leaders. They mostly follow the ETL procedure i.e Extracting data files, Trsnforming data into desired formats and Loading the data into data models built by themselves. They ensure to document all processes, models and metric definitions using data dictionaries. Their main tools of trade include excel, Power query, SQL, power BI, R and Python. A question asked by many people is; "What differentiates data analysts from data scientists?" Data scientists make use of historic data to predict what the future would look like. Hencewhy this is coupled with machine learning and artificial intelligence aspects, to build predictive models.
Data engineers source, organize and move data between systems. They also follow the ETL procedure as data analysts do, only that they automate data feeds and store (load) the data in data warehouses. Their main tools of trade can be categorized into cloud services tools e.g AWS, Ms Azure, Coding languages e.g Python and Scala, Big Data manipulcation tools e.g Hadoop and Data Live Streaming tools e.g Kafka and Apache Beam.
Data visualization specialists look into ways of creating visuals that communicate a specific message that is easy to look at and interpret and sometimes on a need basis. Given the recurring business requests, data visualization specialists can create visual scripts that are easy to run to create automated visuals. Their main tools of trade include but are not limited to Tableau, power BI, MS Excel.
Lastly, we have business leaders who make use of output from the data analysts, data visualization specialists and data engineers to make decisions regarding the vision of the firm, coupled with industry, company and market knowledge. They derive more value from data through asking questions that engage thought processes that influence business strategy.
A complete business intelligence team will therefore comprise of data engineers (source and clean data) > data analysts (calculate business metrices) > data visualization experts (build visuals and dashboards) > business leaders (merge data and strategy), in hierarchical order.
Below, we explore an output based on the role of a data visualization expert to create a report and dashboard for a supermarket on their sales in January.
DATA DESCRIPTION.
The data is collected from a region of three cities: Mandalay, Naypyitaw and Yangon. The sales also categorize customers by gender and membership status (customer type). The methods of payment are three: Ewallet, cash or credit card. The products sold can be categorised under the product lines: Home and lifestyle, sports and travel, electronic accessories, food and beverages, fashion accessories, and health and beauty. The period is for the month of January.
Based on the data as provided, we can quickly have a look at the total revenue raised in the month, along with the number of transactions. We may also analyse revenue raised over time and by product line, along with the distribution of sales by gender, membership status and payment method.
REPORTING
From a reporting perspective, we can interact with the data and derive factual information regarding:
- the distribution of the methods of payments across the cities, gender types, customer types and product lines.
- split of transactions and revenues by gender, customer type, product line and for any specific city.
- greatest product line sale by gross profit by city.
- sales over time to identify peak seasons and recession days.
FORWARD LOOKING
The Business leader at the presentation of such a dashboard poses questions regarding low sales at any one period and for any city then researches and recommends certain incentives to boost sales in any areas of concern. Examples of incentives could be:
- identify causes for low and high ratings and establish measures to strengthen good ratings (above 7) and improve on poor ratings (below 7).
- offer incentives to boost sales by gender and customer type.
- offer targeted adds to boost sales of their best performing product lines.


Comments