
THE STUDY OF DATA.
- Luycer Bosire

- Feb 26, 2024
- 1 min read
Data is defined as factual information used for the basis of reasoning, discussions and calculations (The Webster's New Collegiate Dictionary). The revised edition of the dictionary describes data as information specially organized for analysis. Data can be numbers, characters, images or other empirical/recorded forms that can be assessed to make a determination or decision on specified actions.
By closely examining or studying data we can establish patterns to perceive information that can be used to enhance knowledge. As humans, we are in constant need to make life easier through innovations and inventions based off of behavioral patterns in items, living or non-living. We have made it a goal to make use of mother earth, study it, make conclusions and action on our findings. This came to be through data.
As such, the study of and disciplines in the recent past grown popularity and interest for most organizations. As a result, a number of positions related to the science of data have emerged, including but not limited to analytical engineers, business intelligence analysts, data architects, database administrators, and data governance specialists. The conclusions reached and the methods employed in these fields' data analysis and extrapolation are what set them apart. Let's analyze and define these jobs.
Roles in Data
Data science draws on a number of academic fields, including statistics, scientific computers, and scientific methods, procedures, and systems to draw conclusions from noisy, structured, or unstructured data. What distinguishes data analysts from data scientists is a common question. In order to forecast the future, data scientists use historical data. Consequently, to create predictive models, this is combined with elements of artificial intelligence and machine learning.
To produce customized reports and metrics for business leaders and for business growth, data analysts mostly use historical data. They typically use the ETL process, which involves extracting data from files, transforming it into the desired formats, and loading it into data models they have created themselves. They make sure to use data dictionaries to document all processes, models, and metric definitions. Excel, Power Query, SQL, Power BI, R, and Python are some of their primary working tools.
Data engineers collect, arrange, and transfer data among systems. Like data analysts, they likewise follow the ETL process, with the exception that they automate data feeds and load the data into data warehouses. Their primary working tools can be divided into four categories: big data manipulation tools (Hadoop), cloud services tools (AWS, MS Azure), coding languages (Python, Scala), and data live streaming tools (Kafka, Apache Beam). Data architects develop the systems and tools used by data scientists, data analysts, machine learning engineers and artificial intelligence experts. In addition to designing systems and patterns, deploying architecture, modeling data, creating and implementing data strategies in accordance with business objectives, and staying ahead of regulatory compliance, they are aware of what data professionals need. In their daily operations, they primarily employ the computer languages Python, Java, R, and SQL, as well as visualization tools like Tableau. They demonstrate knowledge of data governance, big data analytics, data flow, and automation of integration. Database administrator manages the database of an organization. They are in charge of constantly keeping an eye on the database to ensure proper operation, data security, user access, and permissions to databases. Additionally, they are in charge of ensuring data accessibility by regularly backing up data, retrieving it when required, testing databases to assure their dependable operation, and archiving data. They are renowned to build and develop databases primarily using SQL. To manage and protect data, they collaborate closely with IT security professionals. Data visualization specialists look into ways of creating visuals that communicate a specific message that is easy to look at and interpret and sometimes on a need basis. Given the recurring business requests, data visualization specialists can create visual scripts that are easy to run to create automated visuals. Their main tools of trade include but are not limited to Tableau, power BI, MS Excel. Lastly, we have business leaders who make use of output from the data analysts, data visualization specialists and data engineers to make decisions regarding the vision of the firm, coupled with industry, company and market knowledge. They derive more value from data through asking questions that engage thought processes that influence business strategy.
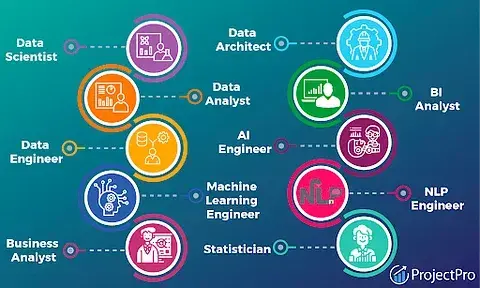
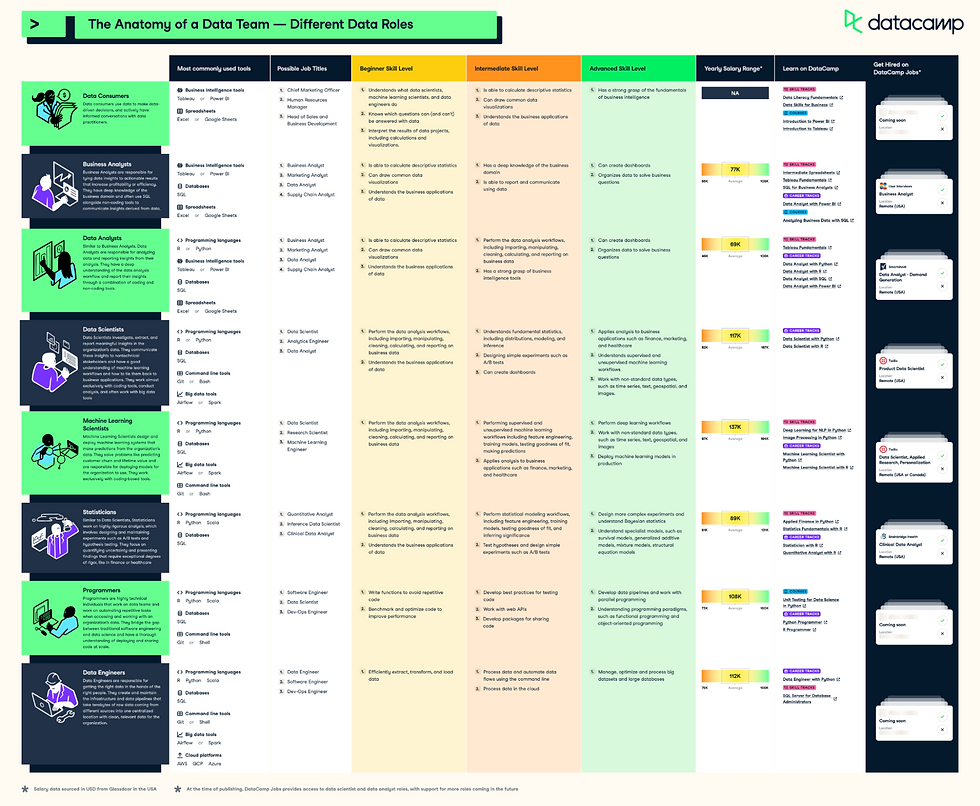
Below are several visuals showing the intersections, interactions and differentiations between various data roles:
Understanding Data Science
Whilst data science is the most known form of the study of data, it is imperative to acknowledge that the study of data encompasses a vast landscape offering inumerable opportunities for individuals across various roles to contribute meaningfully. The inter-discplinary nature of study of data ensures professionals from all forms of science, art or education can collaborate bringing fresh perspectives and driving innovation. It is vital that we appreciate the various roles involved and how they contribute to our understanding and leverage on the power of data to solve complex problems or derive meaning from the vast sea of information surrounding us.


Comments